Tracking real time household power usage in Grafana
The following is part of a series of posts called "Building a household metrics dashboard".
This series details the various steps I took setting up a household dashboard to give the family better insights in a number of different areas such as finances and health, as well as a few other useful metrics and information.
- Building a household metrics dashboard - 26 June 2020
- Tracking real time household power usage in Grafana - 10 July 2020
- An (almost) fully automated exporting of HealthKit data - 18 July 2020
There are a good number of products available on the market for tracking power usage, and I’ve even pitched a startup idea called Utilitracker previously around this concept.
Tracking real time usage of the power that you use in your home is something I feel needs to almost be mandated in future. The common person with very little electrical knowledge can have some wildly incorrect ideas around the power that they use in their home. I’ve met a good number of people who with great intensions continually turn off their LED based lights in unused rooms for minutes at a time or even unplug their unused phone chargers to save power, but then sleep with the air conditioner on over night. We’re talking orders of magnitude difference. Giving people the ability to understand power usage is the first step in moving towards heavily curbing our combined use.
I feel having this information on display will help our family make better decision around our power usage and will help teach our kids to be a lot more environmentally focused. And hey, hopefully help my wallet as well.

My initial approach for this project was to look into what trackers are available and the market leader at the current time from my searching appears to be the product Sense. Not too expensive, but after looking at my power box, the installation wouldn’t be possible as our house uses power rails, not cables when coming in off the mains.
Looking at other alternatives, I came across Emporia Energy who offer a different style of tracker which appeared compatible, but also a cheap tracker for smart meters.
This piqued my interest. It appears California being forward thinking has invested in installing smart meters in houses for a number of years now and this includes PG&E in our area.
I ordered one and once it had arrived it was a pretty simple set up. Within a 10 minutes, I got to the point of having real time usage data showing up in the Emporia app. Good information all for a $40 outlay.

The next step was getting access to this data to use in my Grafana dashboard. This was a little more tricky. Obtaining the data from PG&E appeared to be a huge amount of work, as you need to become a third party provider to the company in some ways. Even if you are only accessing your data, they treat you like you are a service any customer can use so the hurdles here appeared pretty significant.
The other option was figuring out how the Emporia App was actually getting the data from the upstream servers and this seems to be an issue a few people have already looked at solving.
I managed to find python and java solutions to pull the data, but neither of these really fit into my current Grafana set up nicely. The authentication system for the Emporia API also uses AWS Cognito which I hadn’t used before so I decided to do write my own solution in Javascript.
As I’m using Grafana, I created an express API that implements what is required for the Grafana
SimpleJSON data source which returns current usage as well as 15 minute aggregated usage data.
// Heavily based on https://github.com/magico13/PyEmVue

const express = require('express');
const bodyParser = require('body-parser');
const fetch = require('node-fetch');

const {
  CognitoUserPool,
  AuthenticationDetails,
  CognitoUser,
} = require('amazon-cognito-identity-js');

const UserPoolId = 'us-east-2_ghlOXVLi1';
const ClientId = '4qte47jbstod8apnfic0bunmrq';
const Username = 'YOUR EMPORIA USERNAME';
const Password = 'YOUR EMPORIA PASSWORD';

const app = express();
app.use(bodyParser.json());

const cache = {
  expiry: 0,
  fifteenMinute: {
    target: 'fifteenMinute',
    datapoints: [],
  },
  oneMinute: {
    target: 'oneMinute',
    datapoints: [],
  },
};

const poolData = {
  UserPoolId,
  ClientId,
};
const userPool = new CognitoUserPool(poolData);

const authenticationData = {
  Username,
  Password,
};
const authenticationDetails = new AuthenticationDetails(
  authenticationData,
);

const userData = {
  Username,
  Pool: userPool,
};

const cognitoUser = new CognitoUser(userData);

const updateAccessTokenIfRequired = () => new Promise((res, rej) => {
  if (new Date().getTime() / 1000 + 60 >= cache.expiry) {
    cognitoUser.authenticateUser(authenticationDetails, {
      onSuccess(result) {
        const previousAccessToken = cache.accessToken;
        cache.accessToken = result.getIdToken().getJwtToken();
        cache.expiry = result.getIdToken().payload.exp;
        console.log(`Updated access token and set new expiry to ${new Date(cache.expiry * 1000)}`);
        res();
      },

      onFailure(error) {
        console.error(error.message || JSON.stringify(error));
        rej(error);
      },
    });
  } else {
    res();
  }
});

let deviceId;
let lastFifteenMinuteUpdate = 0;

const updateFifteenMinute = async () => {
  if (new Date().getTime() - 1000 * 60 * 7 < lastFifteenMinuteUpdate) return;
  await updateAccessTokenIfRequired();
  const tomorrowMidnightUtc = new Date(new Date(`${(new Date()).toString().slice(0, 15)} 00:00:00 UTC`).getTime() + 1000 * 60 * 60 * 24);
  const previous7Days = new Date(tomorrowMidnightUtc.getTime() - 1000 * 60 * 60 * 24 * 7);

  const response = await fetch(
    `https://api.emporiaenergy.com/usage/time?start=${previous7Days.toISOString()}&end=${tomorrowMidnightUtc.toISOString()}&type=INSTANT&deviceGid=${deviceId}&scale=15MIN&unit=WATTS&channels=1%2C2%2C3`,
    {
      method: 'GET',
      headers: {
        authtoken: cache.accessToken,
      },
    },
  );
  const data = await response.json();
  let time = new Date(data.start).getTime();
  cache.fifteenMinute.datapoints = data.usage.map((value) => {
    const timestamp = time;
    time += 1000 * 60 * 15;
    return [
      value,
      timestamp,
    ];
  });
  console.log(`${cache.fifteenMinute.datapoints.length} fifteenMinute points available`);
  lastFifteenMinuteUpdate = new Date().getTime();
};

const updateOneMinute = async () => {
  await updateAccessTokenIfRequired();
  const tomorrowMidnightUtc = new Date(new Date(`${(new Date()).toString().slice(0, 15)} 00:00:00 UTC`).getTime() + 1000 * 60 * 60 * 24);
  const previousHour = new Date(new Date(`${(new Date()).toString().slice(0, 21)}`).getTime() - 1000 * 60 * 10);

  const currentResponse = await fetch(
    `https://api.emporiaenergy.com/usage/time?start=${previousHour.toISOString()}&end=${tomorrowMidnightUtc.toISOString()}&type=INSTANT&deviceGid=${deviceId}&scale=1S&unit=WATTS&channels=1%2C2%2C3`,
    {
      method: 'GET',
      headers: {
        authtoken: cache.accessToken,
      },
    },
  );

  const currentData = await currentResponse.json();
  let currentStart = new Date(currentData.start).getTime();
  cache.oneMinute.datapoints = currentData.usage.map((value) => {
    const timestamp = currentStart;
    currentStart += 1000;
    return [
      value,
      timestamp,
    ];
  })
    .filter(([i]) => i);
};

const start = async () => {
  await updateAccessTokenIfRequired();
  const customerResponse = await fetch(
    'https://api.emporiaenergy.com/customers?email=emporia%40ianbelcher.me',
    {
      method: 'GET',
      headers: {
        authtoken: cache.accessToken,
      },
    },
  );
  const { customerGid } = await customerResponse.json();
  const deviceResponse = await fetch(
    `https://api.emporiaenergy.com/customers/${customerGid}/devices?detailed=true&hierarchy=true`,
    {
      method: 'GET',
      headers: {
        authtoken: cache.accessToken,
      },
    },
  );
  const { devices: [{ deviceGid }] } = await deviceResponse.json();
  deviceId = deviceGid;

  await updateOneMinute();
  await updateFifteenMinute();

  app.get('/', (req, res) => res.send('Ok!'));
  app.post('/', (req, res) => res.send('Ok!'));
  app.post('/search', (req, res) => res.json(['fifteenMinute', 'oneMinute']));
  app.post('/annotations', (req, res) => res.json([]));
  app.post('/query', async (req, res) => {
    if (req.body.targets[0].target === 'oneMinute') {
      await updateOneMinute();
      return res.json([
        cache.oneMinute,
      ]);
    }
    await updateFifteenMinute();
    return res.json([
      cache.fifteenMinute,
    ]);
  });

  app.listen(80, () => {
    console.log('Listening on 80');
  });
};

start();
Once this is up and running, it is simply a case of installing the SimpleJSON data source plugin
in Grafana
(see here for
install instructions), and creating a new data source pointing to the express api.
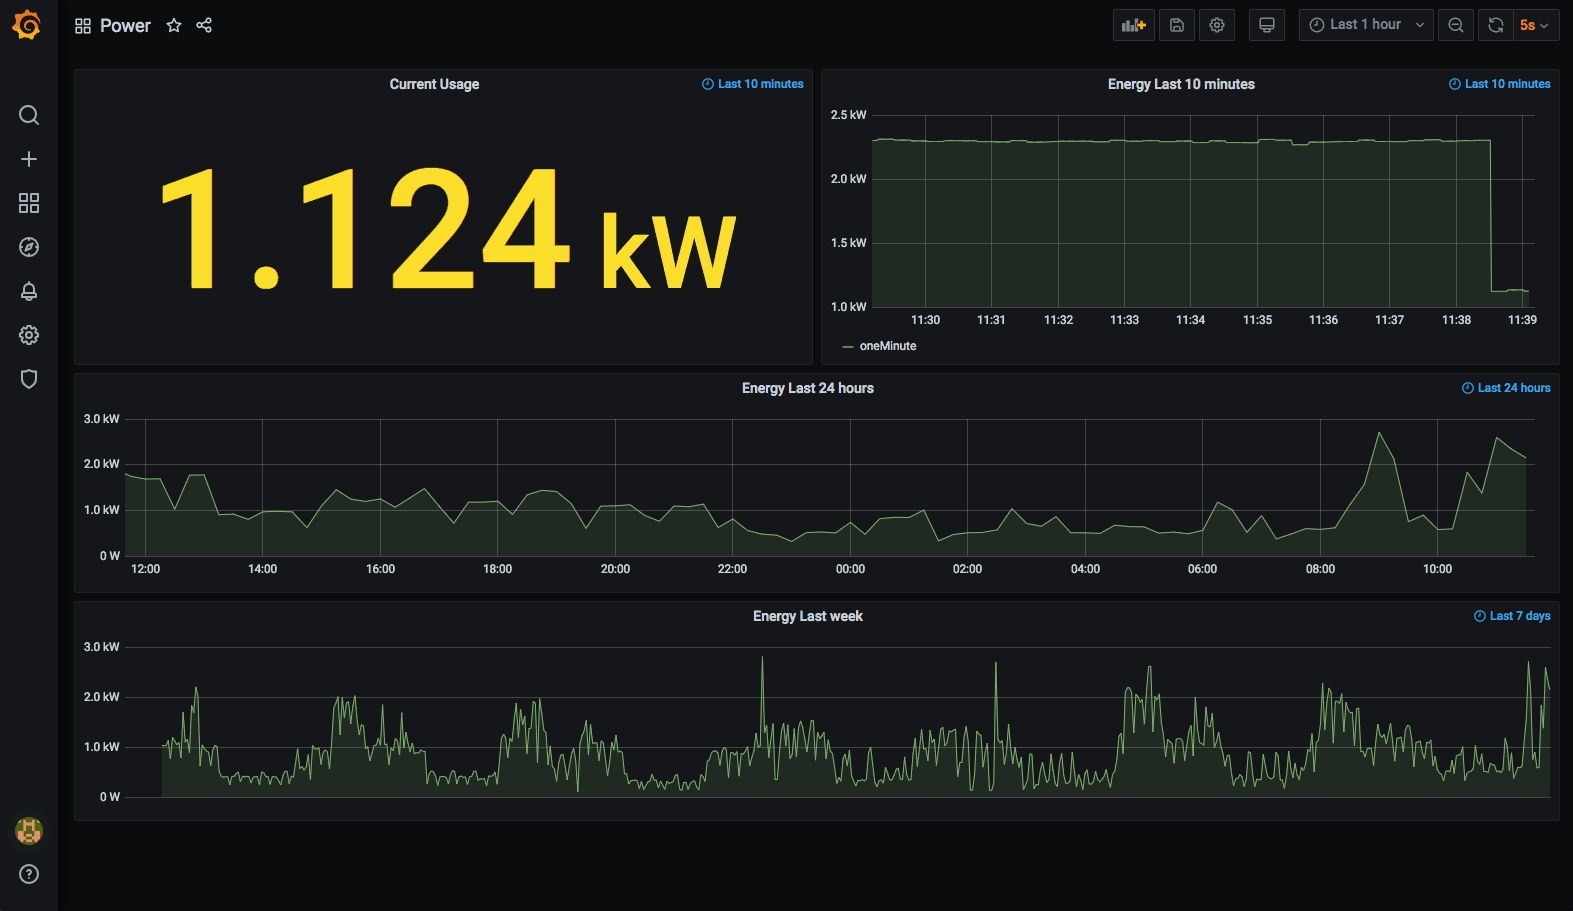
As far as the power dashboard in Grafana, this is what I currently have set up. It shows current usage, and a graph of the last 10 minutes, last 24 hours and the last 7 days. Just prior to taking this shot, I turned off the small air conditioner I had running and the drop took about 8 seconds to show up which is not bad considering the distance that data has to travel and the dashboard refreshing every 5 seconds.

If you have done a similar implementation, the configuration for the above dashboard is the following.
{
  "__inputs": [
    {
      "name": "DS_POWER",
      "label": "Power",
      "description": "",
      "type": "datasource",
      "pluginId": "grafana-simple-json-datasource",
      "pluginName": "SimpleJson"
    }
  ],
  "__requires": [
    {
      "type": "grafana",
      "id": "grafana",
      "name": "Grafana",
      "version": "7.3.1"
    },
    {
      "type": "datasource",
      "id": "grafana-simple-json-datasource",
      "name": "SimpleJson",
      "version": "1.4.1"
    },
    {
      "type": "panel",
      "id": "graph",
      "name": "Graph",
      "version": ""
    },
    {
      "type": "panel",
      "id": "stat",
      "name": "Stat",
      "version": ""
    }
  ],
  "annotations": {
    "list": [
      {
        "builtIn": 1,
        "datasource": "-- Grafana --",
        "enable": true,
        "hide": true,
        "iconColor": "rgba(0, 211, 255, 1)",
        "name": "Annotations & Alerts",
        "type": "dashboard"
      }
    ]
  },
  "editable": true,
  "gnetId": null,
  "graphTooltip": 0,
  "id": null,
  "links": [],
  "panels": [
    {
      "datasource": "${DS_POWER}",
      "fieldConfig": {
        "defaults": {
          "custom": {},
          "mappings": [],
          "thresholds": {
            "mode": "absolute",
            "steps": [
              {
                "color": "green",
                "value": null
              },
              {
                "color": "#EAB839",
                "value": 500
              },
              {
                "color": "yellow",
                "value": 1000
              },
              {
                "color": "red",
                "value": 2000
              }
            ]
          },
          "unit": "watt"
        },
        "overrides": [
          {
            "matcher": {
              "id": "byName",
              "options": "oneMinute"
            },
            "properties": [
              {
                "id": "unit",
                "value": "watt"
              }
            ]
          }
        ]
      },
      "gridPos": {
        "h": 8,
        "w": 12,
        "x": 0,
        "y": 0
      },
      "id": 3,
      "options": {
        "colorMode": "value",
        "graphMode": "area",
        "justifyMode": "auto",
        "orientation": "auto",
        "reduceOptions": {
          "calcs": [
            "lastNotNull"
          ],
          "fields": "/^Last \\(not null\\)$/",
          "values": false
        },
        "textMode": "auto"
      },
      "pluginVersion": "7.3.1",
      "targets": [
        {
          "refId": "A",
          "target": "oneMinute",
          "type": "timeserie"
        }
      ],
      "timeFrom": "10m",
      "timeShift": null,
      "title": "Current Usage",
      "transformations": [
        {
          "id": "reduce",
          "options": {
            "reducers": [
              "lastNotNull"
            ]
          }
        }
      ],
      "type": "stat"
    },
    {
      "aliasColors": {},
      "bars": false,
      "dashLength": 10,
      "dashes": false,
      "datasource": "${DS_POWER}",
      "fieldConfig": {
        "defaults": {
          "custom": {},
          "mappings": [],
          "thresholds": {
            "mode": "absolute",
            "steps": [
              {
                "color": "green",
                "value": null
              },
              {
                "color": "red",
                "value": 80
              }
            ]
          }
        },
        "overrides": [
          {
            "matcher": {
              "id": "byName",
              "options": "oneMinute"
            },
            "properties": [
              {
                "id": "unit",
                "value": "watt"
              }
            ]
          }
        ]
      },
      "fill": 1,
      "fillGradient": 0,
      "gridPos": {
        "h": 8,
        "w": 12,
        "x": 12,
        "y": 0
      },
      "hiddenSeries": false,
      "id": 2,
      "legend": {
        "avg": false,
        "current": false,
        "max": false,
        "min": false,
        "show": true,
        "total": false,
        "values": false
      },
      "lines": true,
      "linewidth": 1,
      "nullPointMode": "null",
      "options": {
        "alertThreshold": true
      },
      "percentage": false,
      "pluginVersion": "7.3.1",
      "pointradius": 2,
      "points": false,
      "renderer": "flot",
      "seriesOverrides": [],
      "spaceLength": 10,
      "stack": false,
      "steppedLine": false,
      "targets": [
        {
          "refId": "A",
          "target": "oneMinute",
          "type": "timeserie"
        }
      ],
      "thresholds": [],
      "timeFrom": "10m",
      "timeRegions": [],
      "timeShift": null,
      "title": "Energy Last 10 minutes",
      "tooltip": {
        "shared": true,
        "sort": 0,
        "value_type": "individual"
      },
      "transformations": [],
      "type": "graph",
      "xaxis": {
        "buckets": null,
        "mode": "time",
        "name": null,
        "show": true,
        "values": []
      },
      "yaxes": [
        {
          "format": "watt",
          "label": null,
          "logBase": 1,
          "max": null,
          "min": null,
          "show": true
        },
        {
          "format": "short",
          "label": null,
          "logBase": 1,
          "max": null,
          "min": null,
          "show": true
        }
      ],
      "yaxis": {
        "align": false,
        "alignLevel": null
      }
    },
    {
      "aliasColors": {},
      "bars": false,
      "dashLength": 10,
      "dashes": false,
      "datasource": "${DS_POWER}",
      "fieldConfig": {
        "defaults": {
          "custom": {},
          "mappings": [],
          "thresholds": {
            "mode": "absolute",
            "steps": [
              {
                "color": "green",
                "value": null
              },
              {
                "color": "red",
                "value": 80
              }
            ]
          }
        },
        "overrides": [
          {
            "matcher": {
              "id": "byName",
              "options": "oneMinute"
            },
            "properties": [
              {
                "id": "unit",
                "value": "watt"
              }
            ]
          }
        ]
      },
      "fill": 1,
      "fillGradient": 0,
      "gridPos": {
        "h": 6,
        "w": 24,
        "x": 0,
        "y": 8
      },
      "hiddenSeries": false,
      "id": 4,
      "legend": {
        "avg": false,
        "current": false,
        "max": false,
        "min": false,
        "show": false,
        "total": false,
        "values": false
      },
      "lines": true,
      "linewidth": 1,
      "nullPointMode": "null",
      "options": {
        "alertThreshold": true
      },
      "percentage": false,
      "pluginVersion": "7.3.1",
      "pointradius": 2,
      "points": false,
      "renderer": "flot",
      "seriesOverrides": [],
      "spaceLength": 10,
      "stack": false,
      "steppedLine": false,
      "targets": [
        {
          "refId": "A",
          "target": "fifteenMinute",
          "type": "timeserie"
        }
      ],
      "thresholds": [],
      "timeFrom": "24h",
      "timeRegions": [],
      "timeShift": null,
      "title": "Energy Last 24 hours",
      "tooltip": {
        "shared": true,
        "sort": 0,
        "value_type": "individual"
      },
      "transformations": [],
      "type": "graph",
      "xaxis": {
        "buckets": null,
        "mode": "time",
        "name": null,
        "show": true,
        "values": []
      },
      "yaxes": [
        {
          "format": "watt",
          "label": null,
          "logBase": 1,
          "max": null,
          "min": null,
          "show": true
        },
        {
          "format": "short",
          "label": null,
          "logBase": 1,
          "max": null,
          "min": null,
          "show": true
        }
      ],
      "yaxis": {
        "align": false,
        "alignLevel": null
      }
    },
    {
      "aliasColors": {},
      "bars": false,
      "dashLength": 10,
      "dashes": false,
      "datasource": "${DS_POWER}",
      "fieldConfig": {
        "defaults": {
          "custom": {},
          "mappings": [],
          "thresholds": {
            "mode": "absolute",
            "steps": [
              {
                "color": "green",
                "value": null
              },
              {
                "color": "red",
                "value": 80
              }
            ]
          }
        },
        "overrides": [
          {
            "matcher": {
              "id": "byName",
              "options": "oneMinute"
            },
            "properties": [
              {
                "id": "unit",
                "value": "watt"
              }
            ]
          }
        ]
      },
      "fill": 1,
      "fillGradient": 0,
      "gridPos": {
        "h": 6,
        "w": 24,
        "x": 0,
        "y": 14
      },
      "hiddenSeries": false,
      "id": 5,
      "legend": {
        "avg": false,
        "current": false,
        "max": false,
        "min": false,
        "show": false,
        "total": false,
        "values": false
      },
      "lines": true,
      "linewidth": 1,
      "nullPointMode": "null",
      "options": {
        "alertThreshold": true
      },
      "percentage": false,
      "pluginVersion": "7.3.1",
      "pointradius": 2,
      "points": false,
      "renderer": "flot",
      "seriesOverrides": [],
      "spaceLength": 10,
      "stack": false,
      "steppedLine": false,
      "targets": [
        {
          "refId": "A",
          "target": "fifteenMinute",
          "type": "timeserie"
        }
      ],
      "thresholds": [],
      "timeFrom": "7d",
      "timeRegions": [],
      "timeShift": null,
      "title": "Energy Last week",
      "tooltip": {
        "shared": true,
        "sort": 0,
        "value_type": "individual"
      },
      "transformations": [],
      "type": "graph",
      "xaxis": {
        "buckets": null,
        "mode": "time",
        "name": null,
        "show": false,
        "values": []
      },
      "yaxes": [
        {
          "format": "watt",
          "label": null,
          "logBase": 1,
          "max": null,
          "min": null,
          "show": true
        },
        {
          "format": "short",
          "label": null,
          "logBase": 1,
          "max": null,
          "min": null,
          "show": true
        }
      ],
      "yaxis": {
        "align": false,
        "alignLevel": null
      }
    }
  ],
  "refresh": "5s",
  "schemaVersion": 26,
  "style": "dark",
  "tags": [],
  "templating": {
    "list": []
  },
  "time": {
    "from": "now-1h",
    "to": "now"
  },
  "timepicker": {},
  "timezone": "",
  "title": "Power",
  "uid": "AHEpZk5Mk",
  "version": 1
}